Blog
Outage monitoring, explained.
Plain-English guides on uptime, status pages, cascading failures and the technical underbelly of modern outages. New posts drop on a regular schedule.
 Oct 22, 2026
Do outages cluster on Mondays? What our Q3 2026 data shows
Incidents per weekday from 2,494 provider-reported incidents, with the limits of the data.
- Oct 20, 2026
Monitoring your own product: a founder checklist that costs nothing
Five checks that catch the majority of real outages.
 Oct 15, 2026
Payment outages: what happens to your checkout when your provider wobbles
Timeouts, double charges and abandoned carts during a payment incident.
- Oct 13, 2026
How to write an incident update people actually understand
What to say, when to say it, and what to leave out.
 Oct 8, 2026
How to judge a database platform's outage transparency
Five checks you can do in ten minutes before you commit to a platform.
- Oct 6, 2026
What "degraded performance" means on a status page
Degraded usually means it works, slowly, for some people. Here is how to read it.
- Oct 1, 2026
When your emails stop arriving: sending incidents explained
Queued, delayed, deferred or blocked: reading an email incident correctly.
 Sep 29, 2026
AI API outages: what to do when your model provider slows down
Rate limits, queue delays and partial degradation: how AI outages actually look.
 Sep 24, 2026
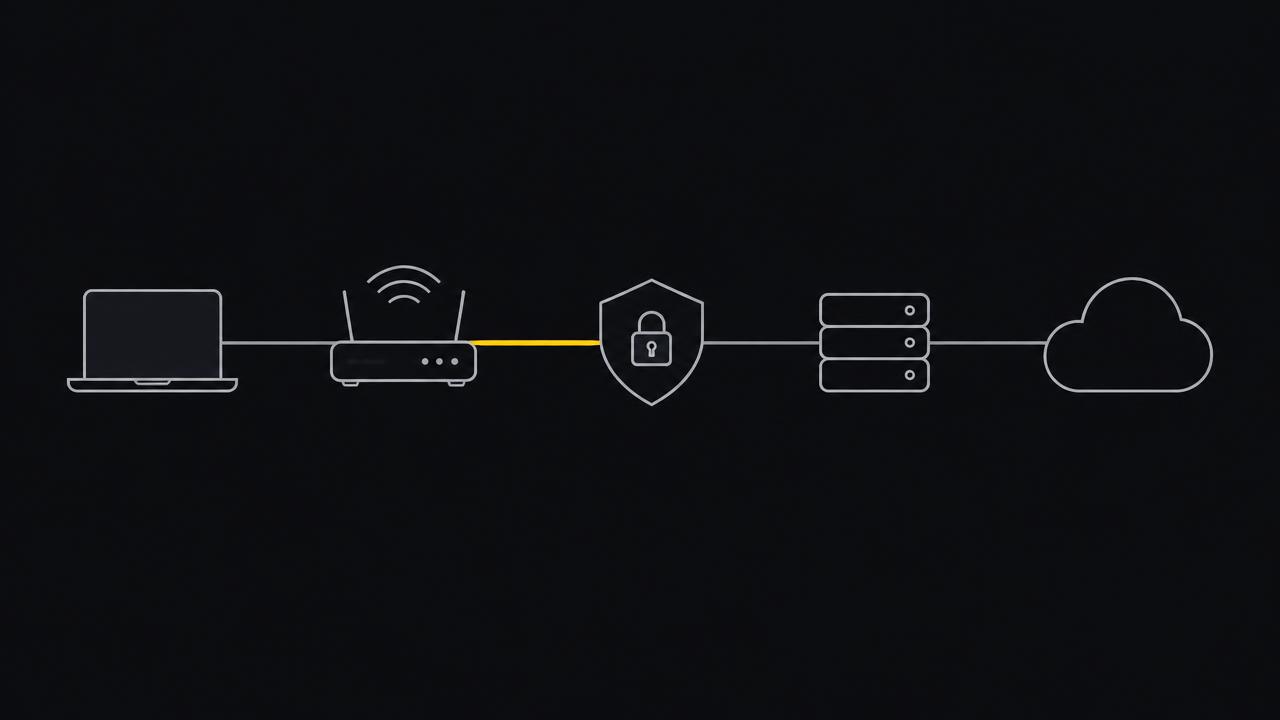
Is it your VPN, your DNS, or the service itself?
A 60 second triage for the most common false alarms.
- Sep 22, 2026
How to build an outage watchlist for your stack
Pick the services that can stop your product, and get alerted instead of guessing.
- Sep 17, 2026
Cloudflare outages: what actually breaks, and what you can do
Error 5xx pages, DNS trouble and login loops: how a Cloudflare incident shows up.
- Sep 15, 2026
Why the status page says everything is fine when it clearly is not
Official pages update after confirmation. Here is how to spot an outage before that.
- Sep 10, 2026
Is Supabase down? How to check in under a minute
Three checks that tell you in under a minute whether Supabase is down for everyone.
- Jul 16, 2026·monitoring
How to monitor the third-party services your app depends on
If your app depends on six external services, you have six possible outages you do not control. Here is how to catch them early.
- Jul 14, 2026·troubleshooting
Is my internet down, or just the website? A quick test
Three tests, sixty seconds, definite answer.
 Jul 9, 2026·multi-region
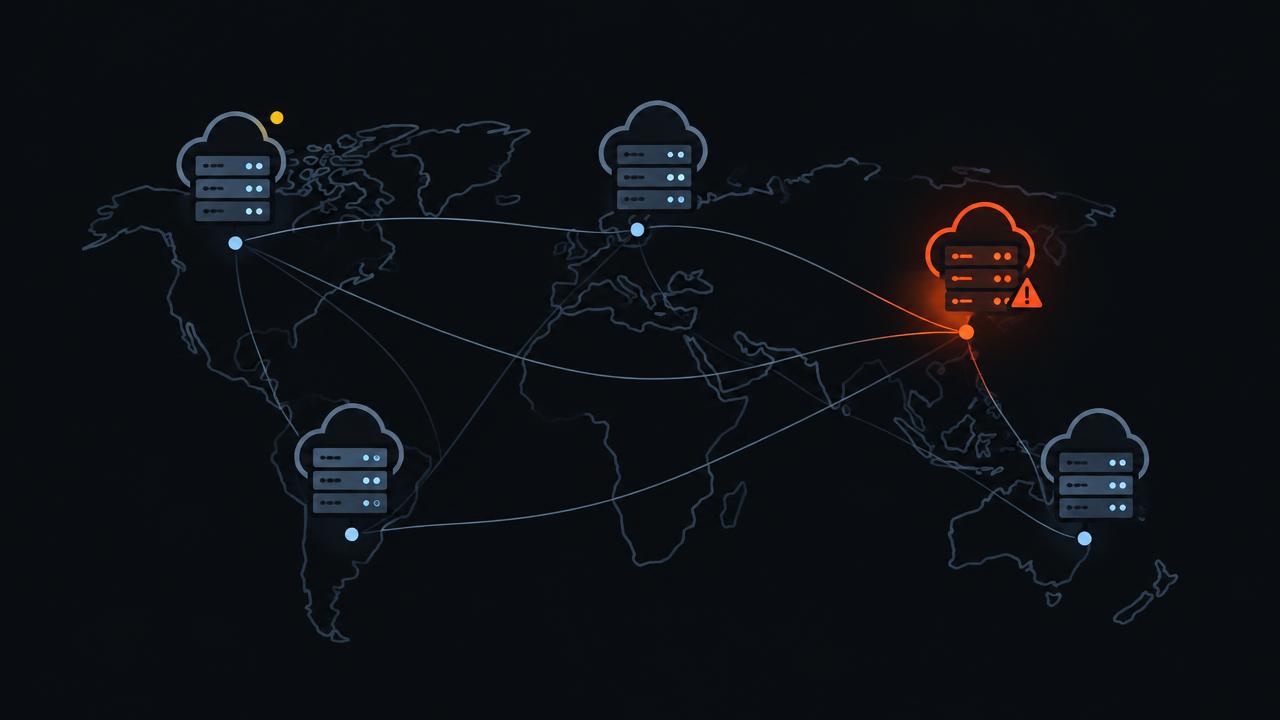
Multi-region failover: what it is, what it costs, when it makes sense
Multi-region failover is the gold standard. It also breaks in subtle ways the first time you really need it.
- Jul 7, 2026·post-mortem
Post-mortems and root cause analyses, explained for normal people
Post-mortems are the most honest documents that companies ever publish. Here is how to read them.
- Jul 2, 2026·rate-limiting
Rate limiting versus an outage: how to tell which one is happening
Rate limiting looks like an outage. It is not. Spotting the difference saves time.
- Jun 30, 2026·dns
DNS outages explained: when the internet forgets how to find things
DNS is the address book of the internet. When it breaks, nothing else matters.
- Jun 25, 2026·incidents
Degraded versus down: when slow is worse than broken
Sometimes the worst outage is the one where everything technically works.
- Jun 23, 2026·cdn
How CDNs work during outages, and when they fail
Your favorite news site goes blank. The site is fine. The CDN in front of it is not.
- Jun 18, 2026·aws
What actually causes most AWS outages?
Same patterns, same outcomes. Here is what keeps breaking at the world's biggest cloud.
- Jun 16, 2026·uptime
Five nines uptime: what 99.999% actually buys you
Five nines is five minutes of downtime per year. Here is what that actually takes.
- Jun 11, 2026·slack
Why is Slack slow today? The usual suspects
Five reasons Slack feels slow today, ranked by how often each one is the actual cause.
- Jun 9, 2026·status-page
What is a status page and why does it matter?
Status pages look simple. They are also the easiest reliability tool to get wrong.
- Jun 7, 2026·uptime
What is uptime, really? A plain-English explainer
Uptime is one of those metrics that looks obvious until you do the math. Here is what 99.9% really means.
- Jun 7, 2026·sla
SLA, SLO, SLI: a plain-English guide to the three letters everyone confuses
Three letters, three jobs. Get them straight and the rest of reliability talk makes sense.
- Jun 7, 2026·outages
Is it down for everyone or just me? A 60-second checklist
Quick checks to figure out if a service is actually down before you panic.
- Jun 7, 2026·cloud
Why one cloud outage takes down half the internet at once
The blast radius of a cloud outage is bigger than most people think. Here is what is really happening.
- Jun 7, 2026·rto
RTO and RPO without the jargon
Two numbers that decide how much an outage will hurt you. Easier than they sound.